Phyllotaxis application features
- Drawing options.
- Number the successive circles in the arrangement
- Connect the circles' centers with lines instead of drawing solid circles
- Draw a set of spiral "bond" lines which indicate which neighboring circle is limiting the maximum size of a particular circle.
- Graphing options.
- Graph showing radius of each of the successive circles in the phyllotaxic arrangement.
- Graph showing density of space (measured as the fraction of space which is contained in the interior of the circles; that is, the fraction of space which is occupied by the area of the circles) as the radius of the density sample increases. Just curious to see if the density was constant.
- Other features
- You can print an image of any phyllotaxis arrangement of any size. The image will be broken down into many pages, if necessary, which you can fasten together somehow. I recommend that you make sure that no graphs and none of the controls are showing when you print.
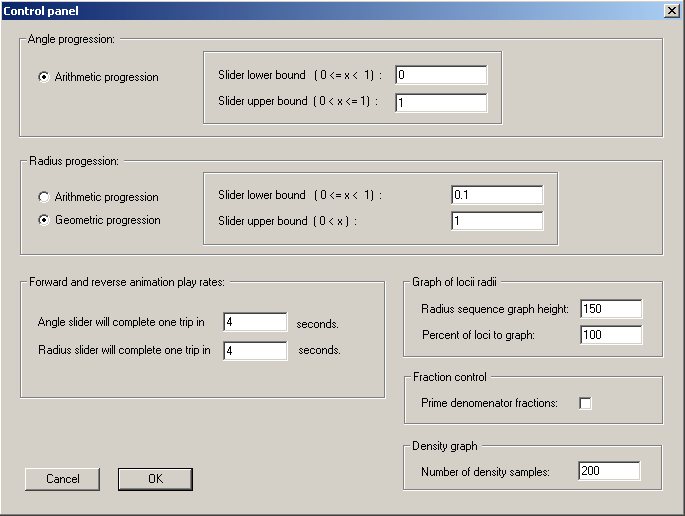
- There is a control panel, accessible from the Controls menu, from which you specify whether the expansion rate for the phyllotaxis arrangement is linear or exponential, where you can set the lower and upper bounds for each of the angle and expansion rate slider controls, specify durations for the individual animations, and specify some things about the graphs. See Figure B.

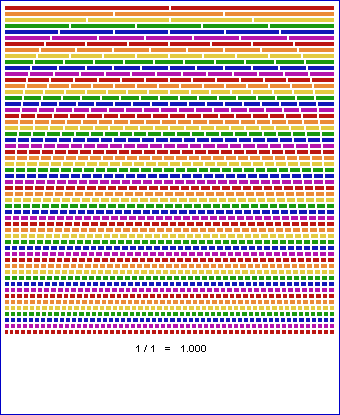
- There is a curious and pretty useless control which I made for specifying fractional values for the angle of a phyllotaxic arrangement. See Figure C. The idea is that the first row of thin colored bars, which has 2 red bars, is for specifying halves. The second row is for specifying thirds, the fourth row for fourths, etc. You simply have to click on one of the bars, or click and drag to see a set of phyllotaxic arrangements with those angles between circles, where one-half means one-half of a circle or 180 degrees.
Figure C


